1. Objectives and legal framework for controlling output quality
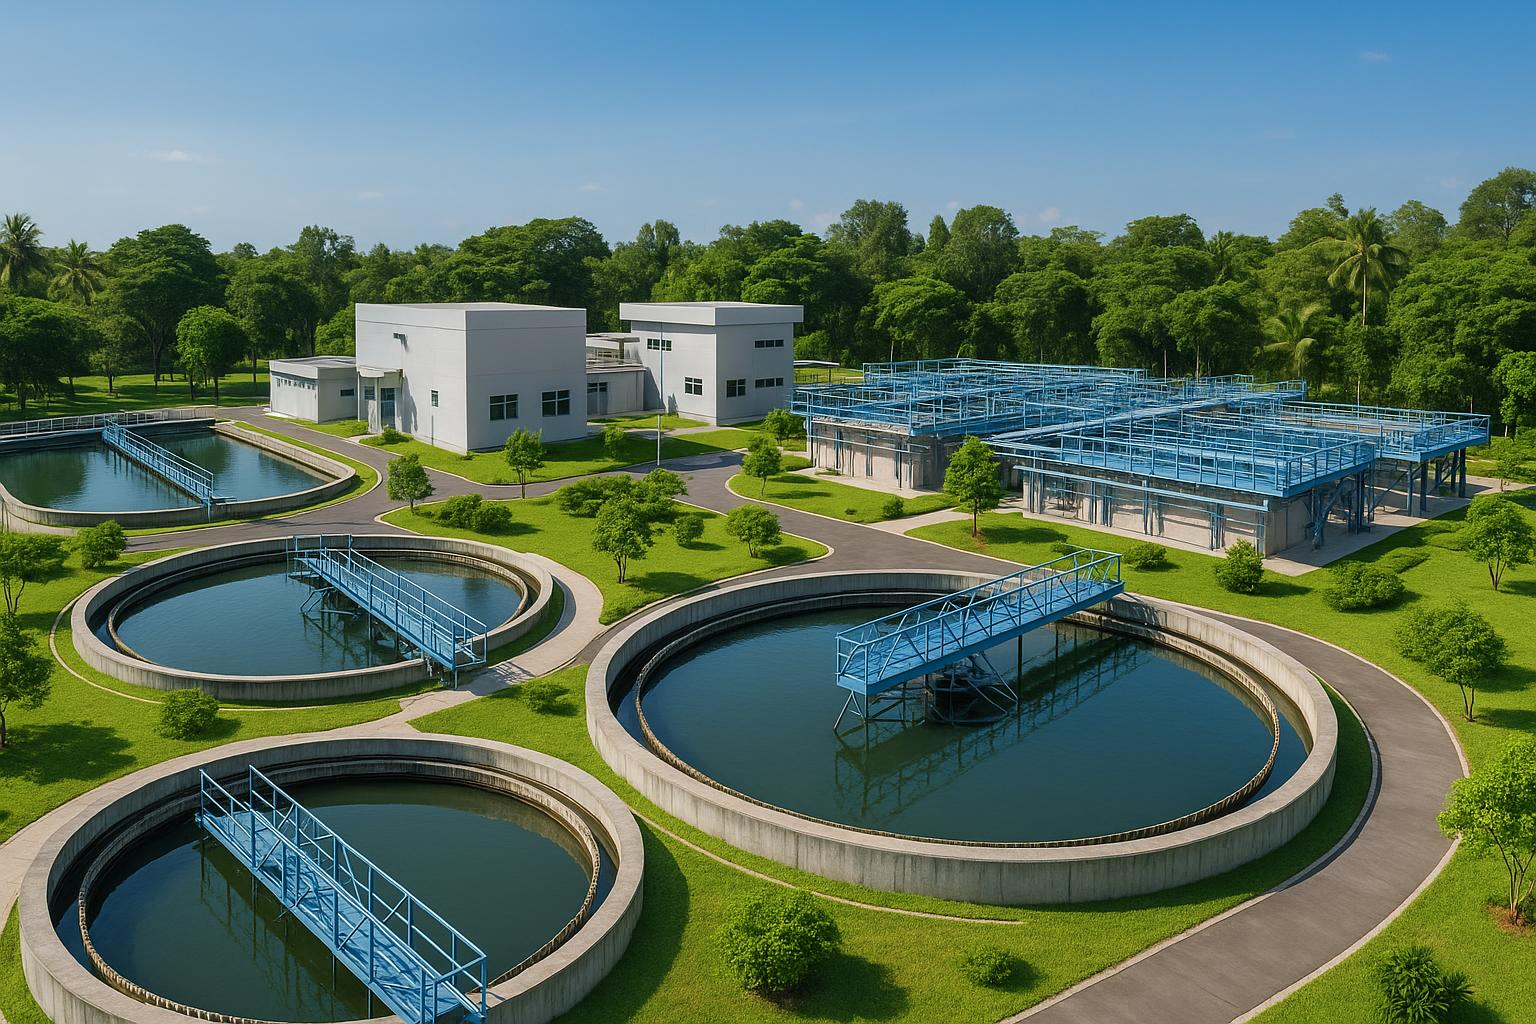
Controlling the output quality of industrial wastewater treatment systems is not only a technical requirement but also a prerequisite for legal and sustainable operation. From an operational perspective, the core objective is to maintain treated wastewater consistently below the specified limits, regardless of fluctuations in load and characteristics of the incoming wastewater. Legally, the current compliance thresholds for industrial wastewater are stipulated in QCVN 40:2025/BTNMT, issued under Circular 06/2025/TT-BTNMT. This standard establishes limit values for many key parameter groups such as BOD5, COD, TSS, nutrients (N, P), toxic compounds (cyanide, phenol), mineral oils, along with some other specific indicators.
According to the published technical documents, QCVN 40:2025/BTNMT will take effect from 01/09/2025 and adds a classification of receiving sources into three columns A/B/C with gradually tightening limits. Specific figures such as BOD5 for Column A is ≤40 mg/L; COD ≤65 mg/L; TSS ≤50 mg/L; Total Nitrogen ≤10 mg/L; Total Phosphorus ≤0.3 mg/L; Ammonium (NH4+) ≤0.5 mg/L; Nitrite (NO2−) ≤0.1 mg/L; Nitrate (NO3−) ≤10 mg/L; cyanide, phenol, sulfide, and mineral oils all have detailed thresholds among the three columns (refer to the complete data in the table below). Understanding the three “target columns” is fundamental to transforming legal requirements into specific operational setpoints at each treatment stage, from pH neutralization, coagulation – sedimentation, flotation, biological treatment, filtration to disinfection.
In practice, many factories have both industrial and domestic wastewater streams. In such cases, it is necessary to clearly separate the scope of application of the standards: the industrial stream is governed by QCVN 40:2025/BTNMT, while the domestic stream falls under QCVN 14:2025/BTNMT. Additionally, for domestic wastewater, the requirement for animal and vegetable oils according to QCVN 14:2008/BTNMT has a maximum allowable level of 5 mg/L (for drinking water sources) and 10 mg/L (for sources not used for drinking water purposes). Correctly identifying the applicable standards for each stream helps in designing, measuring, and reporting separately, avoiding the risk of “misapplying” thresholds.
Conversely, operating engineers need to respond appropriately to the tightening context. QCVN 40:2025/BTNMT lowers the thresholds for many key parameters compared to before and adds Column C, creating a control framework stratified by the sensitivity of the receiving source. This requires reliable technological solutions, while also enhancing automatic monitoring, periodic sampling from accredited laboratories, and standardizing QA/QC processes so that measurement data becomes a management tool for operations, rather than just used during inspections.
2. Establishing indicators and control thresholds according to QCVN 40:2025/BTNMT
To translate “standard thresholds” into “operational objectives,” it is first necessary to classify the receiving discharge points (corresponding to Columns A/B/C) and then associate each parameter with a range of internal control values that are safer than the thresholds. For example, if the compliance requirement for BOD5 Column A is ≤40 mg/L, the operational target should be set lower to absorb fluctuations in organic load, microbial incidents, and measurement errors. This principle similarly applies to COD, TSS, N, P, ammonium, mineral oils, cyanide, phenol, sulfide… At a detailed level, BOD5 and COD are baseline measures of organic pollution, TSS reflects sludge control, the N-P group indicates nutrient control and the risk of eutrophication, while the toxic compound group represents the “non-negotiable” environmental safety requirement.
The standard also recognizes some alternative assessment methods. For instance, for COD, the total organic carbon (TOC) index can be used with equivalent values according to each limit column. In design – operation, this opens opportunities to use online TOC sensors at some rapid monitoring points, combined with laboratory COD analysis for verification. For factories with high organic loads (e.g., paper production, food processing), both BOD5 and COD should be monitored, as BOD5 reflects the biodegradable organic portion, while COD represents the total oxidizable substances, including those that are difficult to biodegrade.
2.1. Limit table for some parameters according to QCVN 40:2025/BTNMT
| Parameter | Column A | Column B | Column C | Source |
|---|---|---|---|---|
| BOD5 (mg/L) | ≤ 40 | ≤ 60 | ≤ 120 | QCVN 40:2025/BTNMT |
| COD (mg/L) | ≤ 65 | ≤ 90 | ≤ 150 | QCVN 40:2025/BTNMT |
| TSS (mg/L) | ≤ 50 | ≤ 100 | ≤ 150 | QCVN 40:2025/BTNMT |
| Total Nitrogen (mg/L) | ≤ 10 | ≤ 20 | ≤ 40 | QCVN 40:2025/BTNMT |
| Total Phosphorus (mg/L) | ≤ 0.3 | ≤ 0.5 | ≤ 1.0 | QCVN 40:2025/BTNMT |
| Ammonium – NH4+ (mg/L) | ≤ 0.5 | ≤ 1.0 | ≤ 5.0 | QCVN 40:2025/BTNMT |
| Nitrate – NO3− (mg/L) | ≤ 10 | ≤ 15 | ≤ 25 | QCVN 40:2025/BTNMT |
| Nitrite – NO2− (mg/L) | ≤ 0.1 | ≤ 0.2 | ≤ 1.0 | QCVN 40:2025/BTNMT |
| Sulfide – S2− (mg/L) | ≤ 0.2 | ≤ 0.5 | ≤ 1.0 | QCVN 40:2025/BTNMT |
| Cyanide – CN− (mg/L) | ≤ 0.001 | ≤ 0.05 | ≤ 0.1 | QCVN 40:2025/BTNMT |
| Phenol (mg/L) | ≤ 0.02 | ≤ 0.1 | ≤ 0.5 | QCVN 40:2025/BTNMT |
| Surfactants (mg/L) | ≤ 0.5 | ≤ 1.0 | — | QCVN 40:2025/BTNMT |
| Mineral oils (mg/L) | ≤ 5 | ≤ 10 | ≤ 20 | QCVN 40:2025/BTNMT |
Note: for COD, the corresponding TOC index can be applied according to each limit column. When implementing the monitoring plan, it is advisable to clearly specify the measurement points, methods (TOC or COD), and the action trigger thresholds for each target column of the factory.
2.2. Interpretation and transformation of thresholds into operational objectives
To proactively achieve thresholds, engineers often plan a target range lower than the standard limits, taking into account input fluctuations. For example, with TSS Column B being ≤100 mg/L, the control target after sedimentation – filtration can be set lower to compensate for load increases or fluctuations in sludge. For the nutrient group, bringing ammonium (NH4+) below the Column A threshold (≤0.5 mg/L) requires synchronized biological design – operation: an aerobic zone with sufficient dissolved oxygen (DO), an anoxic zone for denitrification, and pH – alkalinity control to ensure sustainable nitrification/denitrification rates.
At the operational level, several core parameters need to be maintained stably to support the entire technology chain. For instance, DO in the aerobic tank should be kept around 2–4 mg/L for stable microbial activity (if DO is too low, microorganisms weaken; too high leads to energy waste and affects sludge structure). Regarding pH, design experience indicates that it should be neutralized to a neutral range of about 6.5–8.5 before discharge; however, in compliance monitoring, an allowable range of 5.5–9.0 is often applied depending on the wastewater stream and related standards. Aligning the “target operational pH” and “limit pH” helps engineers respond early when the system deviates from the safe zone.
3. Parameter monitoring checklist – measurement methods, thresholds, corrective actions
The monitoring checklist not only lists parameters but also connects each indicator with the responsible treatment stage, action trigger thresholds, measurement methods, and quick corrective measures. Below are the core parameter groups, along with operational recommendations based on published technical data.
3.1. pH and alkalinity – the foundation of all stages
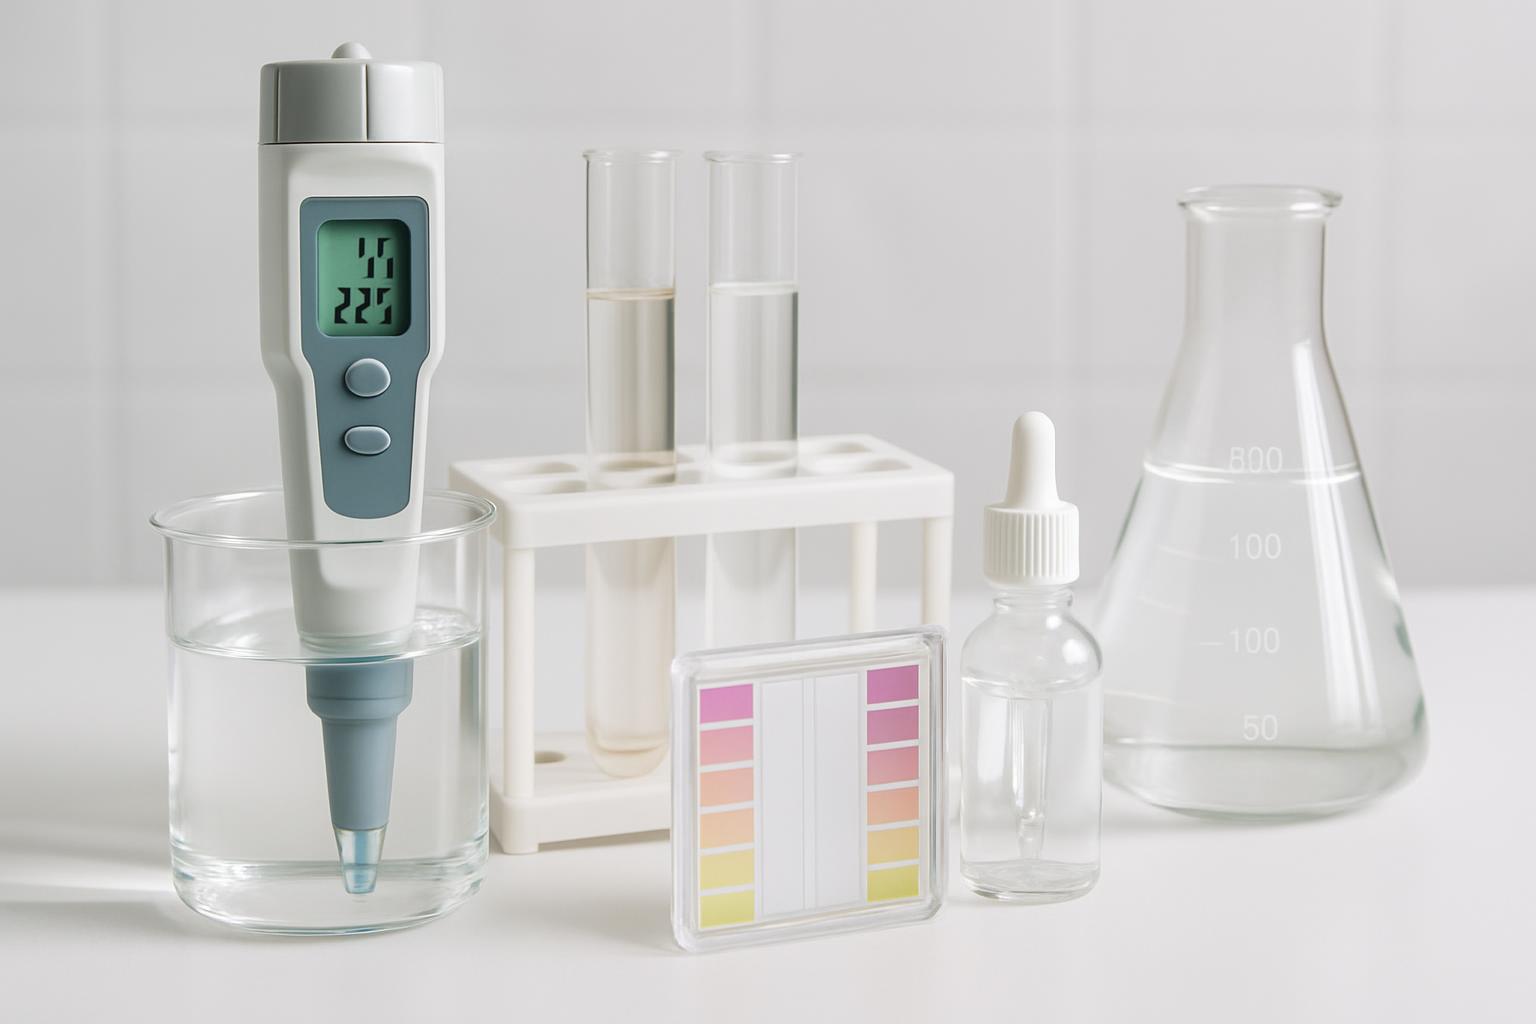
pH is a sensitive variable that directly affects coagulation – floc formation, metal precipitation, flotation, oxidation – reduction reactions, and especially microbial performance. Industrial wastewater exhibits a wide range of pH fluctuations depending on the production stage; designs need to include neutralization to bring pH to a neutral range of about 6.5–8.5 before discharge. In terms of compliance, the allowable range of 5.5–9.0 is recorded in technical documents for wastewater operations, thus the internal monitoring range should clearly declare two levels: the target operational range (serving technological performance) and the limit range (serving compliance).
Actual pH control should combine: continuous online measurement at the collection/regulation pit to detect shocks, and confirmation through laboratory measurements following QA/QC procedures. When pH deviates, it is necessary to review the quantity of neutralizing chemicals, mixing – contact conditions, and check for cross-effects on adjacent stages (e.g., too low pH will hinder metal hydroxide precipitation; too high pH may reduce floc formation efficiency with certain coagulants).
3.2. DO and microbial mass – ensuring the foundation for biological treatment
In aerobic systems, DO is the “lifeline” of microorganisms. The recommended DO value to maintain in the aerobic tank is around 2–4 mg/L for stable microbial activity. If DO drops, the ability to oxidize BOD5/COD decreases, and the microbial sludge may change color, emit odors, and produce fine sludge bubbles. Conversely, excessively high DO leads to unnecessary energy consumption and may cause flocs to break apart, increasing output TSS. In anoxic/denitrification zones, it is necessary to control so that DO does not “leak” over; otherwise, the denitrification rate will decline.
Effective DO operation requires three layers of control: adequately loaded aeration equipment; clean, calibrated DO probes; and control mechanisms based on load (e.g., adjusting airflow or blower run/rest times based on input COD/TOC). When the microbial system shows stress (sudden COD increases, presence of mineral oils, or heavy metals), it is necessary to coordinate nutrient supplementation, monitor toxicity, and adjust the sludge recirculation ratio – sludge age to restore population health.
3.3. BOD5/COD – measuring the “organic load” and responding when thresholds are exceeded
BOD5 reflects the biodegradable organic portion, while COD measures the total oxidizable substances (both easily and difficultly biodegradable). QCVN 40:2025/BTNMT sets BOD5 ≤40/60/120 mg/L and COD ≤65/90/150 mg/L (corresponding to Columns A/B/C). For many industries, input COD varies: plating around 300–1000 mg/L; dyeing 500–3000 mg/L; beer production 800–2000 mg/L; paper 2000–3000 mg/L; seafood processing 2000–5000 mg/L; rubber 3000–10000 mg/L. Correctly identifying the “difficulty” of wastewater helps select appropriate technology configurations (chemical – physical pretreatment, coagulation – flotation, aerobic/anoxic biological treatment, anaerobic or combined).
When BOD5/COD output trends approach thresholds, simultaneous checks are needed: (i) aeration intensity and DO; (ii) organic load into the biological tank compared to its receiving capacity; (iii) microbial inhibitors such as cyanide, phenol, mineral oils. Quick measures may include increasing the circulation of healthy activated sludge, temporarily reducing inflow rates, or enhancing coagulation – flotation before biological treatment to reduce the load. In the long term, re-optimizing retention time, adding advanced oxidation steps or supplementary filtration will help create a safe “buffer” when loads fluctuate.
3.4. TSS – controlling sludge and turbidity
High TSS causes water turbidity, sludge deposition at the receiving source, and carries the risk of transporting pollutants adsorbed on particle surfaces. In terms of impact, TSS values of 100 mg/L or higher can significantly affect aquatic ecosystems, reducing light, depleting dissolved oxygen, and threatening organisms. QCVN 40:2025/BTNMT sets TSS limits of 50/100/150 mg/L depending on Columns A/B/C. Operating to achieve this threshold requires synchronization from proper coagulation – floc formation, effective sedimentation, to final filtration or flotation.
For measurement, it is advisable to combine turbidity sensors (proxy TSS) online at rapid output points with laboratory TSS analysis for confirmation. When TSS increases abnormally, immediately check polymer/mixing conditions, flow velocity in the pipeline leading to the sedimentation tank, sludge condition (floating easily, weak flocs), and washout phenomena due to unstable hydraulic operation. Optimizing the dosing point and chemical mixing, along with timely sludge withdrawal, usually helps stabilize TSS.
3.5. Nitrogen (NH4+, NO2−, NO3−, Total N) – avoiding eutrophication and toxicity
Inorganic nitrogen in wastewater, especially ammonium, when discharged into receiving sources will consume dissolved oxygen and promote eutrophication. In terms of compliance, QCVN 40:2025/BTNMT requires ammonium ≤0.5/1.0/5.0 mg/L; nitrite ≤0.1/0.2/1.0 mg/L; nitrate ≤10/15/25 mg/L; total N ≤10/20/40 mg/L (A/B/C). In treatment, the nitrification – denitrification chain is dominant: ammonium is oxidized to nitrite/nitrate in aerobic conditions (requiring stable DO around 2–4 mg/L and appropriate pH), then nitrate is reduced to nitrogen gas in anoxic zones thanks to a carbon source.
In practice, ammonium also affects the effectiveness of chlorine disinfection; the presence of NH4+ consumes chlorine and forms chloramine, reducing bactericidal capacity. If high ammonium is detected in the output, review the aerobic/anoxic ratio, pH – alkalinity of the aerobic tank, and eliminate microbial inhibitors (heavy metals, toxic compounds). For quick interventions, DO can be increased, carbon sources supplemented in anoxic zones, or inflow rates temporarily reduced to stabilize specialized microbial populations.
3.6. Phosphorus – controlling the risk of eutrophication
For total P, QCVN 40:2025/BTNMT sets strict thresholds, especially Column A ≤0.3 mg/L. Phosphorus is often controlled by chemical precipitation (iron, aluminum salts) and/or enhanced biological processes (EBPR). Effective precipitation operation requires appropriate pH conditions, dosing, and timing; while EBPR requires alternating anaerobic – aerobic conditions for bacteria to accumulate polyphosphate to be effective. When total P trends exceed, combining both mechanisms is often the surest way to reduce quickly.
Besides compliance, controlling P also helps reduce the risk of algae growth in channels, receiving lakes, and avoid unwanted color – odor phenomena. For monitoring, periodically checking total P at points after biological treatment and after coagulation – sedimentation are sensitive locations for detecting abnormalities, while also helping to adjust chemical dosing at optimal costs.
3.7. Mineral oils and surfactants – disruptors of sludge flocs
Mineral oils inhibit biological processes, create films, cause sludge slippage, and reduce treatment efficiency. QCVN 40:2025/BTNMT requires mineral oils ≤5/10/20 mg/L according to Columns A/B/C; while for domestic wastewater, QCVN 14:2008/BTNMT stipulates that animal – vegetable oils must not exceed 5–10 mg/L depending on the receiving source's purpose. When the system shows signs of foaming, oil odors, or reduced biological performance, immediately check the oil separation tank, upgrade DAF flotation, and add powdered/granular activated carbon at suitable locations to adsorb the difficult-to-separate dissolved portion.
Surfactants reduce surface tension, hinder floc formation, and cause persistent foaming. QCVN 40:2025/BTNMT sets limits of ≤0.5 mg/L (Column A) and ≤1.0 mg/L (Column B). When exceeded, review the sources of detergents/industrial chemicals being discharged; enhance coagulation – flotation before biological treatment and consider adding activated carbon. In the aerobic tank, controlling DO and organic load appropriately will help the activated sludge maintain a more stable structure, reducing the risk of fine foaming.
3.8. Heavy metals, cyanide, phenol – the “toxicity” group requiring close monitoring
Heavy metals such as Hg, Cd, Pb, Cr, Ni, Cu, Zn are extremely toxic even at low concentrations. Technical documents show that standards often set very low limits for some heavy metals: for example, mercury around 0.001 mg/L, cadmium about 0.01 mg/L. Operations need to prioritize separation – retention before biological treatment through hydroxide/sulfide precipitation, ion exchange, or adsorption, to avoid inhibiting microorganisms. When there is fluctuating metal loads from workshops (plating, electronics, steel), a conditioning tank and a chemical – physical buffering chain before biological treatment are mandatory.
For cyanide and phenol – which have very low thresholds in QCVN 40:2025/BTNMT (cyanide ≤0.001/0.05/0.1 mg/L; phenol ≤0.02/0.1/0.5 mg/L) – it is necessary to design and operate specialized treatment steps: appropriate oxidation, coagulation – activated carbon, and reliable laboratory monitoring. At the field level, when a bitter almond smell (characteristic of CN) or phenolic odor appears, it is necessary to activate a rapid response process: isolate the source, enhance local treatment, and urgently notify the safety – environmental department.
4. Monitoring procedures, QA/QC, and data management
To control outputs, enterprises need to synchronize three measurement lines: (i) online devices for key indicators such as pH, COD/TOC, TSS for continuous monitoring; (ii) periodic sampling and analysis at accredited laboratories; (iii) internal control (QC) with standard samples, parallel samples, and blanks to ensure reliability. The integrated data system allows for early warnings when parameters deviate from the safe zone, while also maintaining a complete trace for trend assessment, optimizing chemicals – energy, and meeting inspection requirements.
A minimum QA/QC process should clearly describe: sampling locations – frequency, containers – storage, standard analysis methods, calibration – validation of online measuring devices, and action trigger thresholds for corrective actions. When implementing automatic monitoring, ensure that the sample pipeline is clean, retention time does not distort characteristics, and there is a mechanism for periodic cross-checking with laboratory results to adjust algorithms and calibration coefficients of devices.
5. Common incidents and quick corrective measures
5.1. Exceeding COD/BOD5 due to organic load shock
When COD/BOD5 output suddenly increases, the cause often comes from load shocks (e.g., changes in production mode causing input COD to jump from low to high; for some industries, input COD can reach thousands of mg/L). Immediate measures include: temporarily reducing inflow to increase retention time, increasing aeration to maintain DO in the range of 2–4 mg/L, and enhancing physical pretreatment before biological treatment (coagulation – DAF) to reduce the easily floating organic load, emulsions, or adhering mineral oils.
In the long term, it is necessary to reassess the configuration: is there sufficient conditioning volume to “cut peaks”? Has coagulation – floc formation optimized pH and dosing? Does the biological line need to add an anaerobic zone or enhance filtration/oxidation after biological treatment? Online COD/TOC data, combined with laboratory sampling, provide the basis for describing daily – weekly load curves and adjusting operational modes according to production rhythms.
5.2. Loss of nitrification/denitrification, increased ammonium output
When ammonium (NH4+) increases after treatment, immediately check if DO in the aerobic tank has dropped below the range of 2–4 mg/L, if pH has deviated far from neutral, and if any inhibitory compounds (mineral oils, heavy metals) are present. Ammonium also reduces the effectiveness of chlorine disinfection, so it is necessary to lower NH4+ before the disinfection step or adjust the disinfection method accordingly.
Corrective measures include: restoring DO, increasing sludge recirculation to enhance the density of nitrifying microorganisms, supplementing carbon sources in anoxic zones if NO3− is still high, and separating – treating local toxic sources. When incidents recur, consider adding online ammonium/NOx sensors to shift from passive response to load-based control.
5.3. High TSS, floating sludge, and turbid water
Increased TSS can result from weak sludge flocs, hydraulic overload causing washout, or unsuitable polymers. Since TSS ≥100 mg/L can significantly impact ecosystems, early action is needed when an upward trend appears. Quick processing steps include adjusting dosing – coagulation points, optimizing mixing – blending, reducing instantaneous flow, and enhancing sludge withdrawal to reduce sludge concentration in the sedimentation tank.
If floating sludge persists, check for gas generation phenomena in the sedimentation tank (due to denitrification occurring during the sedimentation phase), or thin oil films covering the surface hindering sedimentation. At this point, adding final flotation or fine filtration is an effective supplementary option to “capture” the fine sludge that has not settled.
5.4. Mineral oils and surfactants causing sludge slippage
Mineral oils cause sludge to lose its cohesiveness, create foaming, and emit odors, causing COD/BOD5, TSS outputs to “rise.” When concentrations show signs of approaching the thresholds of 5/10/20 mg/L (depending on the Column), enhance oil separation at the source (grease traps, DAF), and arrange activated carbon at suitable points. For surfactants, it is necessary to control the discharge sources containing detergents; QCVN 40:2025/BTNMT only allows ≤0.5 mg/L (Column A) and ≤1.0 mg/L (Column B). When exceeded, coagulation – flotation before biological treatment and enhanced adsorption often yield quick results.
In terms of operation, monitoring foaming and the stability of sludge flocs is a very sensitive field indicator. At the same time, managing chemicals at the source (replacing detergents, reducing rinsing amounts) helps cut off root causes, reducing pressure on the treatment system.
5.5. Sudden heavy metal spikes – inhibiting microorganisms and toxicity risks
Even at trace levels, heavy metals such as Hg (around 0.001 mg/L), Cd (about 0.01 mg/L) can be compliance barriers and affect biological processes. When suspecting metal loads, it is necessary to shift treatment towards chemical – physical methods: raising pH for hydroxide precipitation or using sulfide precipitation, followed by sedimentation/DAF – filtration. Ion exchange or deep adsorption is used for “difficult” wastewater.
If the factory has many risky workshops, establishing a flow separation and local storage – treatment mechanism during incidents is crucial. In terms of monitoring, one cannot rely on online measurements for most metals; therefore, the sampling – laboratory analysis process is the “backbone” to confirm compliance and adjust technology.
5.6. Ineffective disinfection due to ammonium presence
Chlorine easily reacts with ammonium to form chloramine, reducing bactericidal capacity. When coliform levels are abnormally high despite high chlorine doses, check NH4+ after biological treatment; if not sufficiently lowered, enhance nitrification or change the disinfection method (e.g., UV/ozone depending on conditions). Note that high ammonium is also an indirect indicator of DO, pH, or toxicity issues in the biological cluster.
Quick measures include increasing DO in the aerobic tank, optimizing neutral pH, and controlling the organic load entering the disinfection zone to avoid consuming reducing agents. In the long term, a stable biological configuration is the foundation for achieving effective disinfection.
6. Upgrade roadmap to meet QCVN 40:2025/BTNMT
According to the announced timeline, QCVN 40:2025/BTNMT will take effect from 01/09/2025 along with a transition period for existing facilities. Despite the transition period, the technical recommendation is to proactively review the existing system against the new thresholds (e.g., BOD5 ≤40 mg/L in Column A, COD ≤65 mg/L, ammonium ≤0.5 mg/L), especially if the factory discharges into sensitive sources. “Staying ahead” helps reduce risks when regulatory agencies increase monitoring and avoid hasty investments close to the mandatory application deadline.
The upgrade plan should follow a chain: assessing gaps compared to the QCVN 40:2025/BTNMT thresholds; small-scale pilot testing with key technologies such as upgrading coagulation – DAF, enhancing biological treatment (aerobic/anoxic), adding advanced filtration/oxidation, adsorption; standardizing online – laboratory monitoring for data-driven operations. For internal domestic wastewater streams, apply QCVN 14:2025/BTNMT and refer to the requirements for animal – vegetable oils according to QCVN 14:2008/BTNMT when controlling flow separation.
7. Conclusion and operational recommendations
Controlling output quality in industrial wastewater systems is a synchronized challenge between technology, measurement, and data management. QCVN 40:2025/BTNMT sets stricter limit frameworks for BOD5, COD, TSS, N, P, and many toxic substances, requiring treatment configurations of sufficient depth, along with proactive monitoring strategies. In terms of operations, maintaining DO in the range of 2–4 mg/L in the aerobic tank, neutralizing pH to 6.5–8.5 before discharge, and controlling pretreatment (coagulation – DAF, oil separation) are the “supports” to ensure stable outputs, even when inflow loads fluctuate.
At the system level, investing in online measuring devices for pH, COD/TOC, TSS; enhancing sampling – analysis at accredited laboratories; and applying strict QA/QC will turn data into an advantage. When detecting negative trends (COD/BOD5 approaching, TSS increasing, ammonium rising), clear action trigger thresholds and quick corrective processes are necessary. The upgrade roadmap according to QCVN 40:2025/BTNMT should be initiated early, prioritizing pilot – adjustment – expansion to meet legal requirements while optimizing operational lifecycle costs.
FAQ
-
What are the BOD5, COD, TSS levels according to QCVN 40:2025/BTNMT?
QCVN 40:2025/BTNMT stipulates BOD5 ≤40/60/120 mg/L and COD ≤65/90/150 mg/L according to Columns A/B/C; TSS limits are ≤50/100/150 mg/L respectively. These are output limit thresholds, so operational targets should be set lower to absorb fluctuations and measurement errors.
-
What should the DO level be maintained at in the aerobic tank for stable treatment?
Technical documents recommend maintaining DO around 2–4 mg/L for effective and stable microbial activity. Too low DO reduces organic oxidation, while too high causes energy waste and may affect the structure of sludge flocs.
-
How to control ammonium and total N according to QCVN 40:2025/BTNMT?
QCVN 40:2025/BTNMT sets ammonium (NH4+) ≤0.5/1.0/5.0 mg/L; nitrite ≤0.1/0.2/1.0 mg/L; nitrate ≤10/15/25 mg/L; total N ≤10/20/40 mg/L corresponding to Columns A/B/C. A well-operating nitrification – denitrification chain is required, with appropriate DO and pH to achieve these thresholds.
-
What are the oil and grease limits in wastewater according to which standards?
For industrial wastewater, QCVN 40:2025/BTNMT stipulates mineral oils ≤5/10/20 mg/L for Columns A/B/C. For domestic wastewater, QCVN 14:2008/BTNMT stipulates that animal – vegetable oils must not exceed 5 mg/L (for drinking water sources) and 10 mg/L (for other sources).
-
What should the output pH target be set at for both efficiency and compliance?
Design experience indicates that pH should be neutralized to a neutral range of about 6.5–8.5 for optimal treatment efficiency. Regarding the allowable framework, technical documents record a range of 5.5–9.0 depending on the wastewater stream and applicable standards.
-
Why is it necessary to closely monitor cyanide, phenol, and heavy metals?
These indicators have very low thresholds in QCVN 40:2025/BTNMT (e.g., cyanide, phenol) and high toxicity even at trace concentrations (such as Hg, Cd). They threaten compliance and can inhibit biological processes, so chemical – physical treatment before biological treatment and reliable laboratory analysis are necessary.
Nanoen
NANO THANG LONG ENVIRONMENTAL COMPANY LIMITED
Hanoi Office: No. 15 TT18 Van Phu Urban Area, Ha Dong, Hanoi
Can Tho Office: 661E/29, Vo Van Kiet Street, Binh Yen A Area, Long Hoa Ward, Binh Thuy District, Can Tho City
Ho Chi Minh City Office: 533/12/7, Pham Van Bach Street, Ward 15, Tan Binh District, Ho Chi Minh City
Hotline: 0986.689.781 - 0969.054.226
Email: thanglongnanoen@gmail.com
Facebook: www.facebook.com/thanglongnanoen