1. Objectives of the daily operation process and compliance requirements
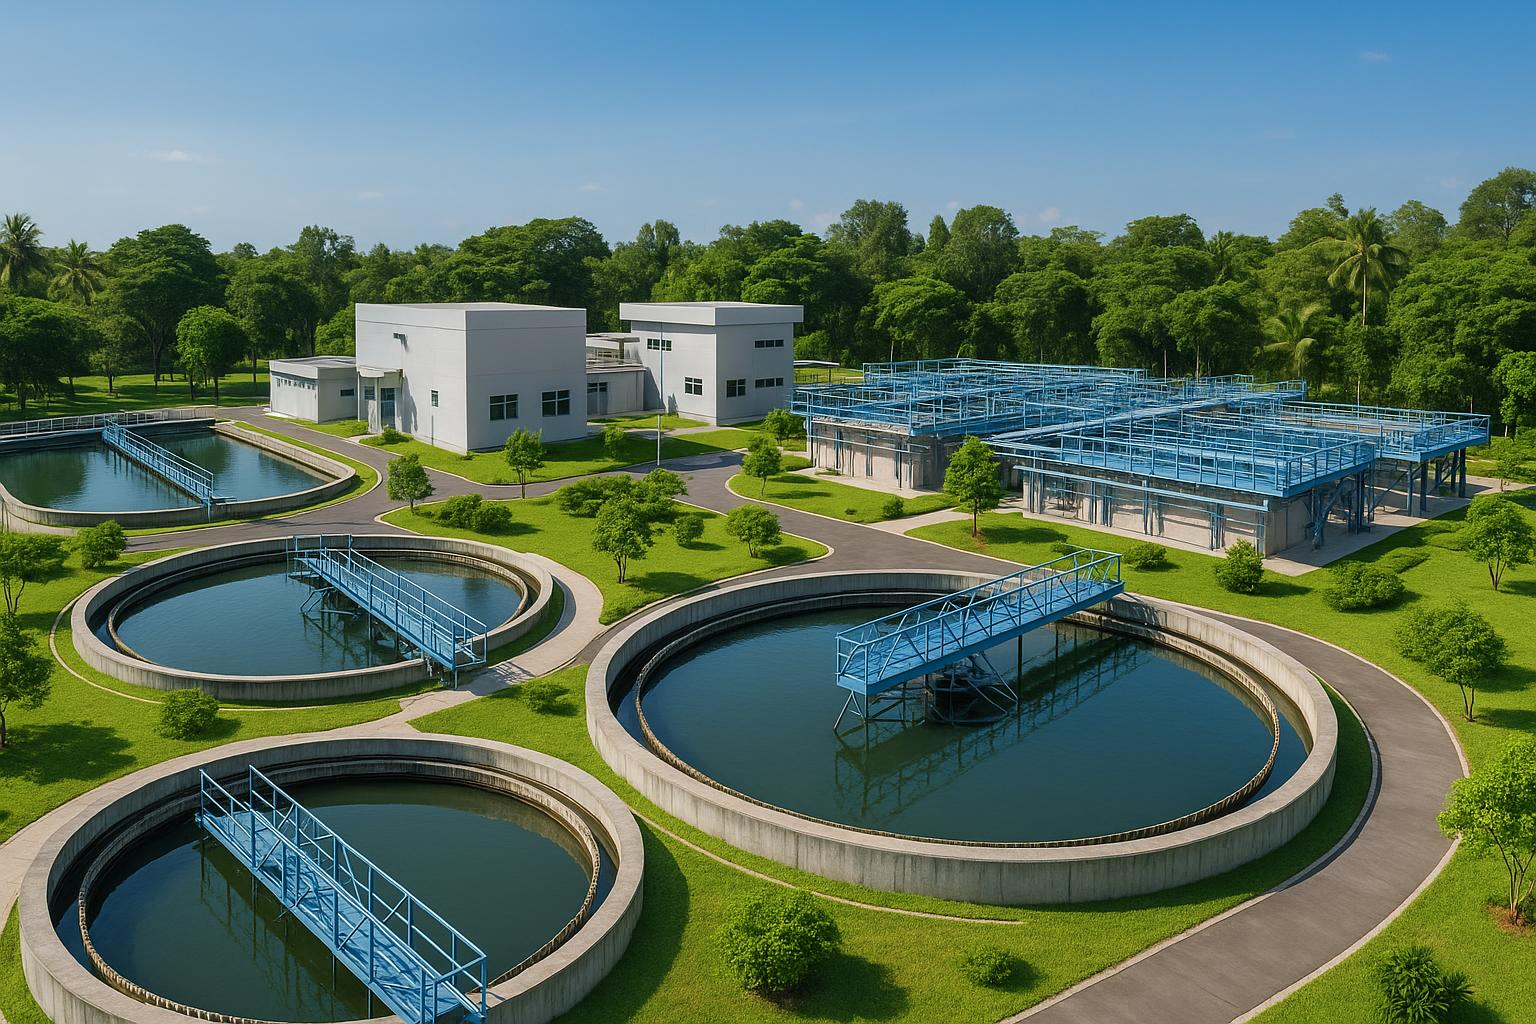
For industrial wastewater treatment systems, the daily operation process is not just a series of repetitive tasks but a risk control mechanism, optimizing performance and ensuring legal compliance. A good process helps stabilize treated water, limit sudden fluctuations in load, and maintain the microbial community in a healthy state. When the steps of inspection, measurement, chemical dosing, gas adjustment, and sludge recirculation are standardized at the level of "hourly, per shift," the plant will proactively prevent incidents such as floating sludge, white foam, H2S odor, or a decrease in BOD/COD/NH4+ removal efficiency.
Regarding the legal framework, industrial wastewater must be compared with the requirements of QCVN 40:2011/BTNMT. Due to the roadmap for applying the new standard QCVN 40:2025/BTNMT, which has been issued under Circular 06/2025/TT-BTNMT, the operation and technical management department should proactively review and update the monitoring - sampling - reporting system to respond promptly when the roadmap takes effect locally. In all cases, the operation log and analysis records must fully demonstrate control evidence to prove compliance with the corresponding output quality standards.
Therefore, the daily operation process must simultaneously integrate three layers of control. The first layer is equipment control (electricity, pumps, gas, pipes - valves), to ensure readiness and safety. The second layer is process control (pH, temperature, DO, MLSS, SV30, flow rate), to timely adjust before the biological system is "shocked." The third layer is legal control - reporting (sampling compared with applicable QCVN, data storage, alerts, and remediation when signs exceed thresholds).
2. Typical technology configuration and key control points
A common industrial wastewater treatment line typically includes: pretreatment (bar screen/filter, oil separation if any), equalization tank, biological block (anaerobic - aerobic), biological sedimentation or membrane separation, disinfection, and sludge treatment. In the pretreatment stage, the goal is to remove coarse debris, reduce the risk of clogging, and equalize flow - load. Cleaning the bar screen, maintaining mixing or light aeration in the equalization tank is necessary to prevent anaerobic conditions, limit H2S, and keep the composition of incoming water stable.
The biological block is the "heart" of the system. In the aerobic tank (Aerotank), maintaining DO in the range of 2 - 4 mg/L is crucial for microbial growth and effective organic matter treatment; DO below 2 mg/L inhibits microorganisms, while DO exceeding 4 mg/L causes electricity waste and can break the floc structure. Managing activated sludge must go hand in hand: monitoring MLSS and checking SV30 to assess sludge health. MLSS is typically maintained at 3,000 - 5,000 mg/L and a "good" SV30 is around 250 - 350 mL/L; these values help operators timely judge phenomena like young sludge, bulking sludge, or poor settling.
The sedimentation and disinfection blocks are the final barriers before discharge. The sedimentation tank requires stable flow, even skimming, and effective sludge collection to limit sludge carryover. The disinfection process using chlorine or UV must ensure the elimination of pathogenic microorganisms without allowing residual disinfectant to exceed permissible levels. For systems with rapidly increasing sludge volumes, regular sludge wasting and dewatering (conveyor, screw press, frame) should be linked to monitoring MLSS/SV30 fluctuations and an approved maintenance plan.
3. Daily operation checklist by shift
3.1. Before starting the shift
Start by checking electrical safety: confirm that the control cabinet is clean, dry, without burnt odors, and that the phase indicator lights are operational. The supply voltage must be stable at 380V/220V as designed; any signs of phase loss, voltage drop, or loose connections must be addressed before powering the pumps and aerators. Simultaneously, patrol the entire pipeline and valves, comparing the open/closed status with the technology diagram to ensure no branches are "forgotten," leading to local blockages or pipeline flooding.
The incoming wastewater needs to be "quickly checked": measure pH, observe color and odor, check temperature. The pH of incoming water should be in the range of 6.5 - 8.5 to avoid "shocking" the biological block; if deviations are detected, prioritize neutralization in pretreatment/equalization before pumping into the biological tank. The favorable operating temperature is around 25 - 35°C, as temperatures that are too low or too high affect microbial activity. Finally, check the inventory of chemicals and the status of dosing pumps (PAC, polymer, NaOH/H2SO4, chlorine/disinfectant), ensuring they are not clogged, leaking, and ready for the entire shift.
3.2. During the operation shift
For the equalization tank, maintain mixing or aeration to prevent sedimentation and odor generation. In the aerobic tank, periodically read DO and adjust airflow to keep DO in the range of 2 - 4 mg/L. If DO drops below 2 mg/L, consider increasing airflow or temporarily reducing load to prevent microbial depletion; if DO exceeds 4 mg/L, reduce airflow to save electricity and maintain floc structure. Concurrently, monitor the sensory characteristics of the sludge (healthy reddish-brown color, natural moist earth smell), record MLSS, and perform a 30-minute settling test (SV30) to timely assess sludge settling - compression trends.
In the sedimentation tank, control the water collection speed and surface skimming to prevent floating scum. Continuously observe the overflow water: if turbidity appears, sludge tails, or unusual cloudiness occurs, immediately check DO, MLSS, SV30 in the biological tank and adjust recirculation - waste sludge. In the disinfection step, monitor the operation of the chlorine dosing pump or UV lamp, ensuring not to overdose as it poses risks of exceeding residual limits and may impact the receiving environment.
3.3. End of shift and recording
The final stage of the shift is the time to "close the numbers" and detect abnormalities for the next shift to have follow-up data. Record electricity consumption, inflow/outflow rates, pH, and DO according to the specified time frame; add notes about unusual phenomena such as sudden increases in white foam, strong pump vibrations, loud blower noises, or unusual odors. Check the SV30 cup that has settled for 30 minutes to determine the sludge volume and describe the sludge surface, including photos (if any) for easy comparison by day/week.
Minor incidents handled during the shift need a brief report: describe the phenomenon, hypothesize the cause, corrective actions taken, and the status after intervention. If signs that may affect output quality are detected (e.g., sludge flowing out of the sedimentation tank or unstable DO), report immediately to technical management to consider increasing measurement frequency, sampling for laboratory analysis, or temporarily reducing load to stabilize the system.
4. Core parameters to monitor and control thresholds
The following indicators are considered the "survival group" of daily operations. The recommended value ranges and warning signs help engineers quickly make adjustment decisions before incidents escalate. Note that all quantitative data below are drawn from specialized references and are suitable for typical aerobic biological systems.
| Parameter | Recommended Threshold | Signs Below Threshold | Signs Above Threshold | Priority Action |
|---|---|---|---|---|
| pH (incoming water) | 6.5 – 8.5 | Microorganisms are "shocked," dark sludge, reduced efficiency | Microbial inhibition, unusual odor | Neutralize in pretreatment/equalization before entering biological treatment |
| Temperature | 25 – 35°C | Slow microbial activity, prolonged treatment time | Risk of microbial depletion, unusual odor | Adjust load, optimize aeration/shading to limit fluctuations |
| DO (aerobic tank) | 2 – 4 mg/L | Microorganisms are inhibited, black sludge, anaerobic odor | Wasted electricity, fragile floc | Increase/decrease airflow to bring DO back to 2 – 4 mg/L |
| MLSS | 3,000 – 5,000 mg/L | Young sludge, poor treatment efficiency | Overloading sedimentation, sludge carryover into water | Regulate recirculation/waste sludge to target range |
| SV30 | 250 – 350 mL/L | Sludge difficult to flocculate, poor settling | Bulking/sludge difficult to compress, easily washed out | Control DO, nutrients, and sludge recirculation |
| Supply Voltage | 380V/220V (stable) | Phase loss, voltage drop causing overheating/low flow | Not applicable | Check the electrical cabinet, fix connections/source errors before running |
At the outlet, the facility must regularly sample and compare with the applicable standards for industrial wastewater according to QCVN 40:2011/BTNMT, while also monitoring the roadmap for applying QCVN 40:2025/BTNMT under Circular 06/2025/TT-BTNMT. The frequency and list of analytical parameters handled by the laboratory must be compatible with the technology and risks of each wastewater industry, but must at least be sufficient to detect deviations in a timely manner.
5. Measurement - recording - response process when exceeding thresholds
5.1. Quick measurement on-site
During the shift, prioritize using handheld meters that are periodically calibrated to measure pH and DO. The "30-minute settling cup" (SV30) should be performed at least once a day, at the same time to have a reliable comparison series; results need to be accompanied by a verbal description of the sludge condition (surface, color, odor) as the sludge morphology is an important indicator. For MLSS, maintain a regular sampling schedule of mixed sludge for internal or external laboratory analysis and results weekly.
Simultaneously, observe inflow/outflow rates and record significant fluctuations hourly. If a "spike" in flow is detected, consider adjusting the distribution into the equalization tank to reduce shock loading for the biological system. For plants with automated monitoring, activate warning thresholds for pH and flow to ensure the shift team is aware and can respond immediately when exceeding preset thresholds.
5.2. Compare with standards and record according to the application roadmap
After compiling quick measurement data, the facility needs to have a sampling schedule for laboratory analysis compared to QCVN 40:2011/BTNMT for industrial wastewater. All calibration records for online/offline measuring devices, analysis sheets, and process adjustment logs must be kept together to form a "chain of evidence" proving proactive quality control operation.
With the roadmap for applying QCVN 40:2025/BTNMT under Circular 06/2025/TT-BTNMT, the technical management team should early update recording forms, restructure the monitoring dashboard, and plan for upgrades (if necessary) in sensitive stages such as sedimentation - disinfection - sampling. This approach helps reduce transition time while limiting legal risks when the new standards come into effect.
5.3. Response scenarios for each group of parameters
When DO drops below 2 mg/L, prioritize increasing airflow and checking the blower's condition (noise - temperature - pressure gauge) to ensure effective gas supply; if no improvement is observed, consider temporarily reducing load, redirecting some to the equalization tank, and reassessing MLSS/SV30 to eliminate causes due to old sludge or poor floc. If DO exceeds 4 mg/L, reduce airflow while observing SV30 in the next 1–2 shifts to ensure floc does not become "fluffed up."
For pH deviating from 6.5 – 8.5 in the incoming stream, neutralize at pretreatment/equalization using the alkaline or acid chemicals currently in use. In cases of hourly pH fluctuations, consider increasing mixing in the equalization tank and dividing the batch supply to "flatten" the fluctuations. When MLSS exceeds 5,000 mg/L or SV30 rises above 350 mL/L, increase the frequency of wasting sludge and immediately check the quality of the sludge recirculated back to the biological treatment to ensure that too much "old" sludge is not being returned.
6. Common incidents and on-site remedies
Thick white foam floating on the surface of the aerobic tank is a common phenomenon when sludge is young, DO fluctuates, or organic load changes rapidly. The priority treatment is to stabilize DO to 2 – 4 mg/L, reassess F/M through the MLSS - flow pair, and adjust the water supply from the equalization tank to be more uniform. In some cases, slightly increasing sludge recirculation and monitoring SV30 for 48 hours will show trends of sludge "maturing" and significant foam reduction.
Floating sludge in the sedimentation tank or tails flowing out of the overflow channel is often related to sedimentation overload, bulking sludge/difficult to compress, or gas flotation. The emergency action is to check DO in the biological tank, re-measure SV30, and review the sludge recirculation flow. If SV30 is high (exceeding 350 mL/L), it is necessary to enhance sludge wasting, reduce short-term loading, and increase DO control in the aerobic zone. When the phenomenon is due to gas flotation (air bubbles pulling sludge up), consider adjusting airflow distribution/degasification conditions before sedimentation.
The H2S "rotten egg" odor arising around the pretreatment - equalization cluster indicates localized anaerobic zones. Immediately check the operation status of the mixing/aeration equipment in the equalization tank and clean coarse debris stuck in the bar screen/filter. Increasing mixing, removing accumulated sludge, and restoring light aerobic conditions in the equalization tank usually resolves the odor in a short time while preventing "sour" water from shocking the biological tank downstream.
Increased noise or vibration from pumps and blowers is an early warning signal of mechanical - electrical failure. Upon detection, stop the machine to check bearings, belts, bases, and casing temperature; simultaneously compare pressure gauges/load levels to detect gas blockages or pipeline blockages. Record thoroughly in the log, along with proposals for replacing materials if excessive wear is observed; early intervention helps prevent the incident from escalating into a complete system shutdown.
7. Regular maintenance and calibration of measuring devices
The maintenance schedule repeating weekly - monthly - quarterly - annually is a "buffer" that significantly reduces the probability of unexpected incidents. Weekly, focus on cleaning fine bar screens, checking filters, and washing the electrodes of pH/DO meters to limit calibration drift. For the equalization tank, clean points prone to fouling, check aeration nozzles to ensure they are not locally clogged, causing uneven gas distribution.
Monthly, check belts, tension, and lubricate rotating parts of blowers; review the entire pipeline and valves, tightening loose connections. At the same time, plan to sample and analyze important process parameters (e.g., BOD, COD, TSS, ammonia depending on the industry) to assess the system's "health" periodically. Quarterly, recalibrate online measuring devices, perform overall cleaning of the sedimentation tank, and remove bottom sludge to restore settling - compression capabilities. Annually, carry out major maintenance, repaint metal pipelines, and replace consumables according to manufacturer recommendations.
Discipline in calibration determines data quality. When using handheld or online pH/DO measuring electrodes, always create calibration records, keep the lot of standard solutions used, and note discrepancies before and after. Reliable measuring devices are the basis for all operational adjustment decisions; "noisy" data from dirty/non-standard sensors often leads to misdirection in adjustments.
8. Monitoring, sampling, and data management systems
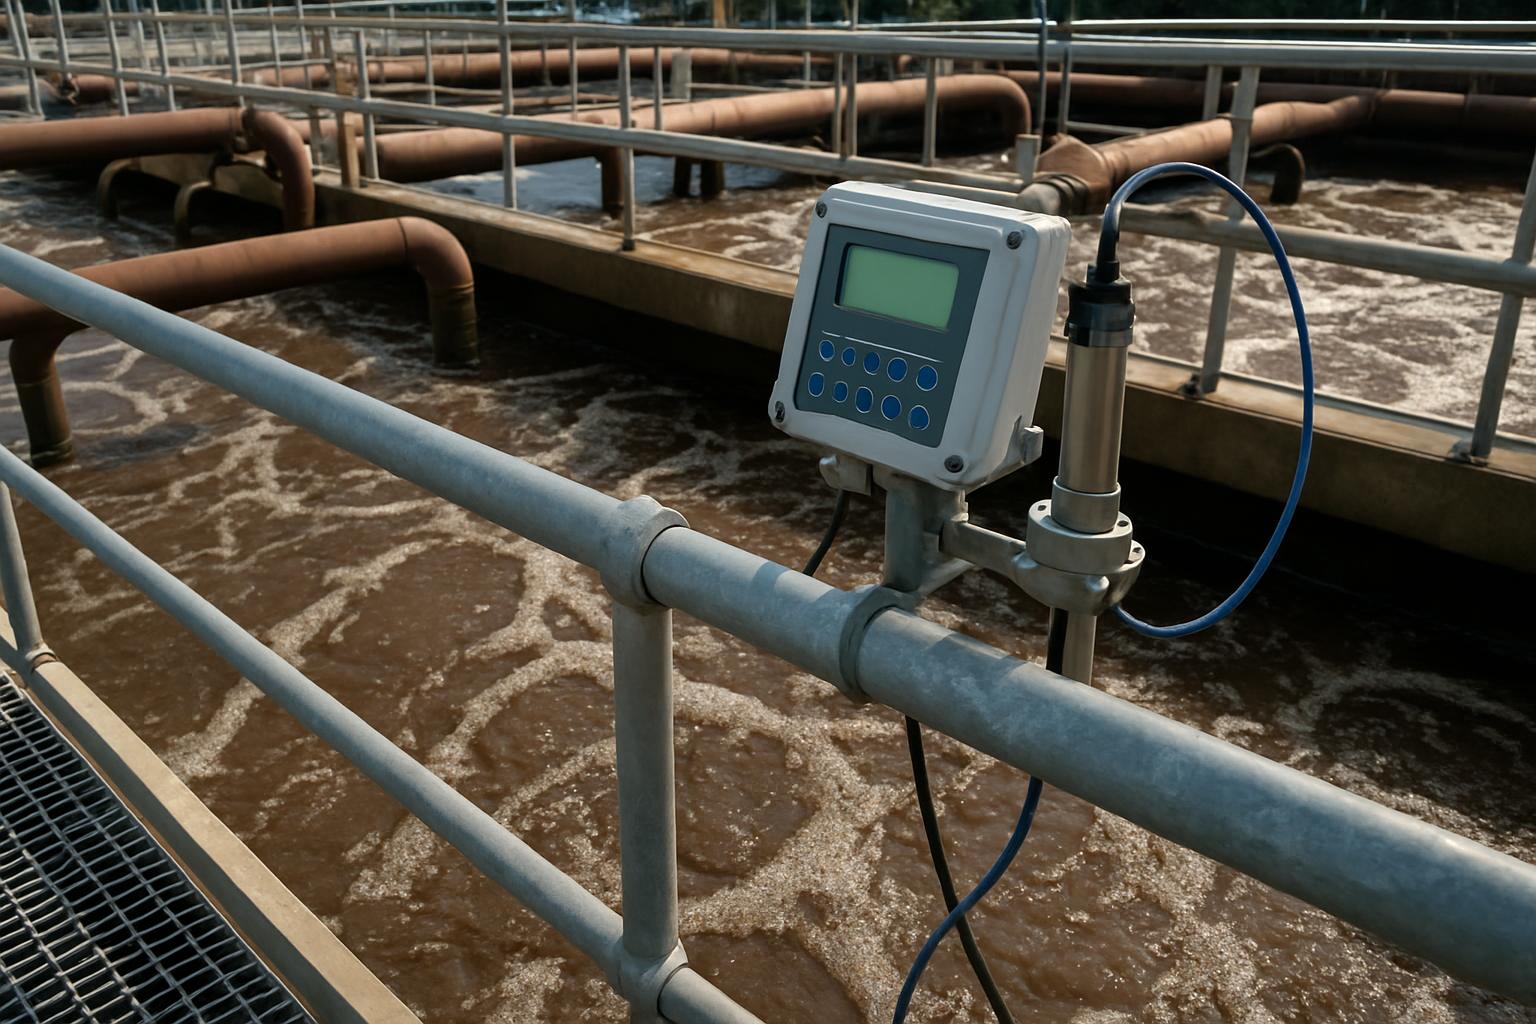
The plant should combine on-site measurements by shift with periodic monitoring and, if conditions allow, integrate an automated monitoring system to provide early warnings when parameters exceed preset thresholds. These systems can continuously log data on pH, flow rate, temperature, and activate automatic sampling mechanisms when abnormal parameters are detected, helping the operating team trace causes and have clear evidence for remedial actions. The key point lies not in the number of sensors but in the feedback process: who receives the alert, how long it takes to check on-site, and the criteria for confirming that the incident has been controlled.
All measurement data - both online and offline - must be organized scientifically: name the working shift, number the tanks/flow transfers, and store photos of the site when abnormalities occur. When laboratory analysis results are available, they should be compared with the process control ranges (e.g., DO 2 – 4 mg/L, MLSS 3,000 – 5,000 mg/L, SV30 250 – 350 mL/L) to assess correlation. A time-based data approach helps detect declining trends before output parameters risk exceeding standards.
9. Recommendations for sustainable operation based on the plant's reality
The focus of sustainable operation is stability and contingency. Stability comes from "equalizing" incoming water with a good equalization tank, controlling DO in the range of 2 – 4 mg/L in aerobic conditions, and keeping MLSS - SV30 within target zones (3,000 – 5,000 mg/L; 250 – 350 mL/L). Contingency comes from a serious maintenance - calibration schedule, ready replacement materials, and a response process when exceeding thresholds that is regularly practiced. When these two factors coexist, the system can absorb shock loads, weather changes, and fluctuations in input materials without compromising output quality.
Regarding compliance, continue operations in accordance with QCVN 40:2011/BTNMT and update the roadmap for QCVN 40:2025/BTNMT through Circular 06/2025/TT-BTNMT. Right now, standardize the SOP manual, shift logs, incident forms, and digital data storage systems to be ready to meet the inspection - monitoring requirements of regulatory agencies. The mindset of "measure - understand - act - prove" must run through all operational decisions of the plant's engineering team.
FAQ
1. Why is DO 2 – 4 mg/L the target range in the aerobic tank?
In the range of 2 – 4 mg/L, aerobic microorganisms have enough oxygen to decompose organic matter steadily; DO lower than 2 mg/L inhibits microorganisms, while higher than 4 mg/L causes electricity waste and can disrupt the floc structure. This range also helps limit odor generation and keeps the tank surface ventilated.
2. How should MLSS and SV30 be read to detect "old" or "young" sludge?
MLSS reflects sludge density, while SV30 indicates settling - compression ability after 30 minutes. When MLSS is high and SV30 exceeds the target range, it usually signals difficult-to-compress sludge or "old" sludge that needs increased wasting; conversely, low MLSS and low SV30 indicate "young" sludge that needs time to grow biomass.
3. When the incoming water pH deviates from 6.5 – 8.5, where should treatment occur?
Ideally, neutralize immediately at pretreatment or equalization to protect the biological tank downstream. Directly introducing pH-deviated water into biological treatment can cause microbial "shock" and reduce efficiency in subsequent shifts.
4. What signs indicate that the sedimentation tank is overloaded?
Turbid overflow water, the appearance of "sludge tails," or floating sludge on the surface are typical signs. At this point, it is necessary to recheck DO in the biological tank, MLSS, and SV30, while adjusting recirculation/waste sludge and reducing short-term loading if necessary.
5. What is the minimum maintenance schedule for the system?
Based on operational experience, there should be a cycle: weekly cleaning of bar screens - pH/DO electrodes; monthly checking belts - lubrication; quarterly calibrating measuring devices - cleaning sedimentation tanks; annually conducting major maintenance and replacing consumables. This schedule helps significantly reduce the likelihood of sudden system shutdowns.
6. Which standards should the output be compared with for industrial wastewater?
The facility needs to compare with QCVN 40:2011/BTNMT for the industrial wastewater currently applied. At the same time, monitor and prepare for the roadmap for applying QCVN 40:2025/BTNMT under Circular 06/2025/TT-BTNMT to update promptly when it takes effect.
Nanoen
NANO THANG LONG ENVIRONMENTAL COMPANY LIMITED
Hanoi Office: No. 15 TT18 Van Phu Urban Area, Ha Dong, Hanoi
Can Tho Office: 661E/29, Vo Van Kiet Street, Binh Yen A Quarter, Long Hoa Ward, Binh Thuy District, Can Tho City
Ho Chi Minh City Office: 533/12/7, Pham Van Bach Street, Ward 15, Tan Binh District, Ho Chi Minh City
Hotline: 0986.689.781 - 0969.054.226
Email: thanglongnanoen@gmail.com
Facebook: www.facebook.com/thanglongnanoen