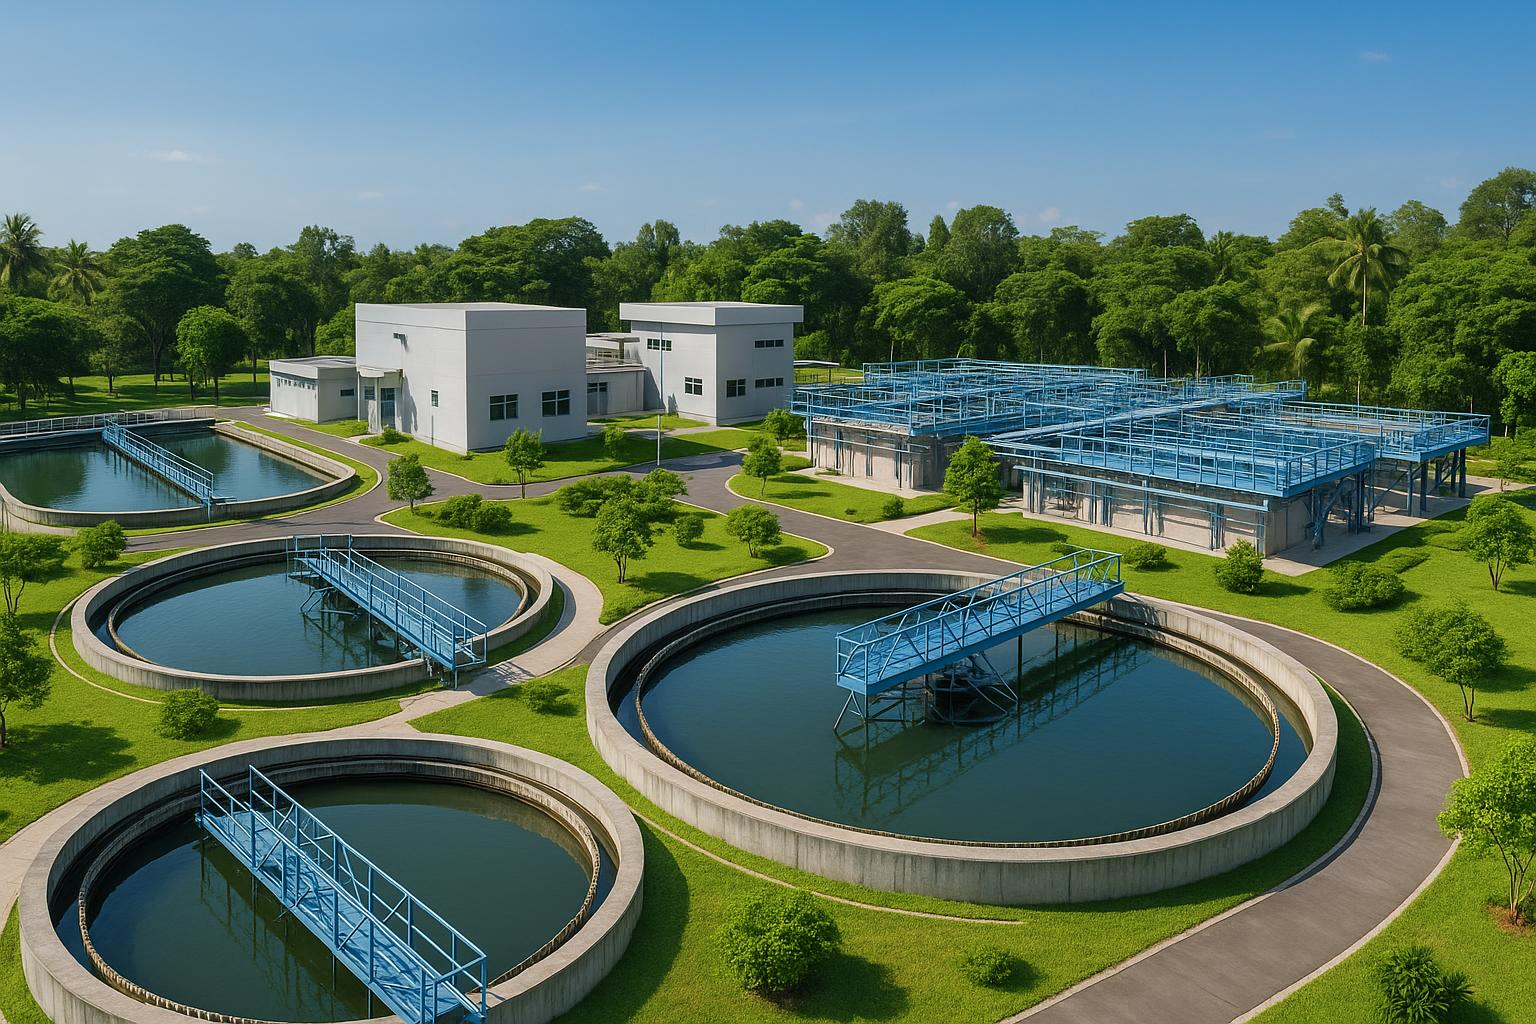
1. The Problem of Optimizing Disinfection Costs: Context and Objectives
In industrial wastewater treatment systems, disinfection is often the final step before discharge, but it significantly influences operating costs, microbial risks, and the stability of the entire process. The goal of optimization is not merely to "reduce chemical costs" in a narrow sense; the core objective is to achieve stable discharge standards, maintain operational safety, and prevent hidden costs such as phenol chlorine odor, corrosion, or microbial recontamination in the discharge line. In many plants, the disinfection chemical portion tends to "inflate" when the quality of the influent water fluctuates, when the operating pH is not tightly controlled, or when contact equipment is suboptimal, leading to increased dosages to wasteful levels without improving microbial indicators as desired.
For compliance standards, businesses need to base their operations on the regulations applicable to the industry and specific discharge sources. When within the appropriate regulatory scope, businesses should refer to QCVN 01-MT:2015/BTNMT to establish control thresholds and risk matrices for the disinfection process. From a technical perspective, microbial indicators are the main drivers for dosage and contact time. Domestic technical documents indicate that after biological treatment, there may still be about 10^5 – 10^6 bacteria per ml of wastewater, thus the final disinfection step is mandatory if Coliform levels are to be brought down to safe control thresholds (< 5000 MPN/100 ml for type A or < 10000 MPN/100 ml for type B). When aligning these objectives with the overall cost picture of the station, it is important to neutralize conflicts between microbial objectives and the energy costs of alternative technologies such as ozone or UV, as well as to optimize pH for maximum chemical effectiveness.
Disinfection costs are also heavily dependent on the "burden" of upstream processes. Common operational data shows that aeration in activated sludge can account for up to 50% of the total energy consumed by the system, while sludge treatment can account for about 20%. This has two implications: optimizing upstream operations helps reduce suspended solids, color, odor, and compounds that react with disinfectants, thereby reducing dosages in the final step; on the other hand, when considering a change in disinfection technology (for example, from chlorine to UV or ozone), the total system costs including energy and maintenance should be evaluated, rather than just comparing individual chemical prices.
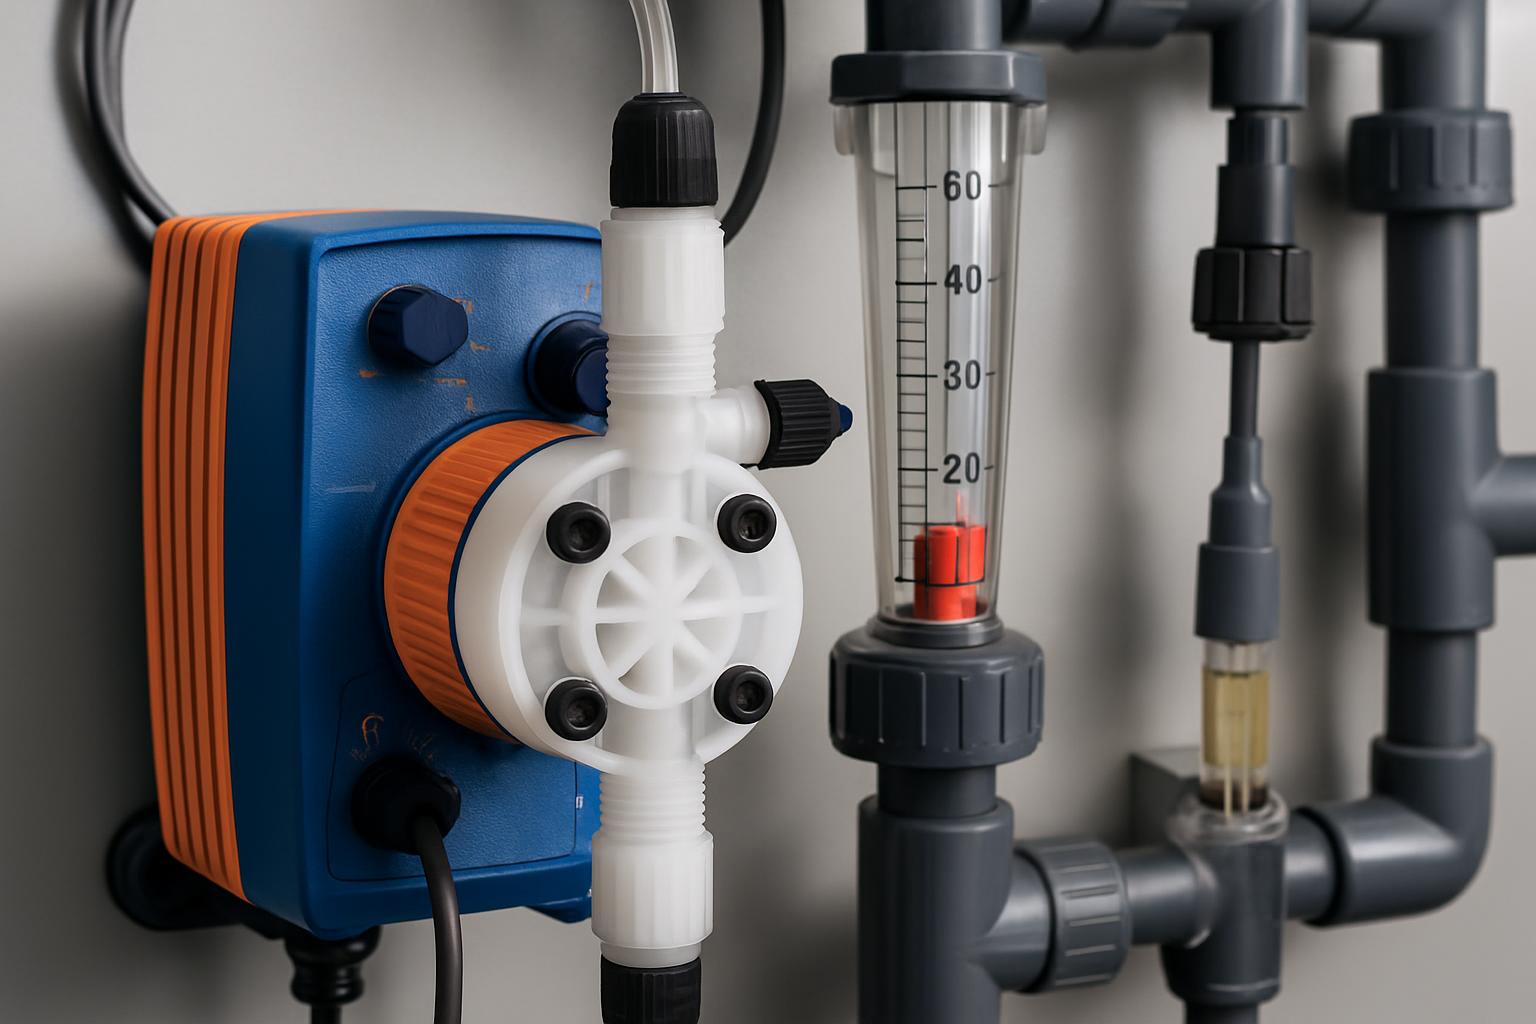
2. Overview of Disinfection Technology Choices and Their Impact on Costs
Three common disinfection solutions in operational practice include: chlorine and chlorine compounds, ozone, and UV light. Each solution has different mechanisms of action, effective operating ranges, and "cost points". Chlorine and chlorine compounds are traditional choices, easy to implement, but their effectiveness is highly dependent on pH due to the balance between HOCl and OCl⁻. As pH increases, the proportion of HOCl – the highly effective form – decreases significantly. In contrast, ozone is a very strong oxidant, dissolves well in water, and does not leave behind sustainable by-products, but the capital investment and energy demand are often higher. UV directly attacks the genetic material of microorganisms, does not create by-products in water, and consumes minimal energy in the contact chamber, but requires water with appropriate clarity and periodic lamp replacement costs.
The effectiveness and cost of the disinfection step itself also depend on the level of "cleaning" beforehand. For example, with chlorine, in addition to the bactericidal reaction, chlorine also reacts with ammonia and dissolved substances; in the presence of phenol, chlorophenol can form and cause unpleasant odors. Therefore, removing phenol and ammonia upstream will significantly reduce chlorine costs and limit odor incidents. With ozone, due to its strong oxidation capability, in addition to disinfection, it can also remove color, phenol, and cyanide, while increasing DO and aiding in the settling of suspended particles – contributing to an increased safety margin for subsequent processes or discharge lines.
In many systems, the addition of automation and remote monitoring helps optimize disinfection costs in real-time. Monitoring and automatic control allow for dosage adjustments according to fluctuating loads, bringing pH into the optimal range for chlorine, or controlling the intensity – contact time of UV appropriate to the instantaneous turbidity. This aspect not only reduces chemical waste but also prevents overdosing that can cause corrosion, odor, or exceed unwanted by-product thresholds.
3. Optimization When Using Chlorine and Chlorine Compounds
The bactericidal effectiveness of chlorine in water mainly depends on the ratio of HOCl to OCl⁻, which is influenced by pH. Technical documents show that at a pH of about 6, HOCl accounts for about 99.5% and OCl⁻ only about 0.5%; at a pH close to 7, HOCl is around 79% while OCl⁻ increases to about 21%; and at a pH of about 8, HOCl drops to about 25% while OCl⁻ increases to about 75%. This explains why, at the same chlorine dosage, a high pH will significantly reduce disinfection effectiveness and necessitate an increase in dosage to achieve the same bactericidal level, leading to higher costs and by-product risks. Therefore, the cost optimization strategy with chlorine often starts from adjusting the pH of the water before disinfection to a range favorable for HOCl dominance.
Besides pH, competing reactive substances in wastewater also directly affect the required dosage. Ammonia consumes chlorine by forming chloramine, slowing down and reducing immediate bactericidal effectiveness; phenolic compounds can react to form chlorophenol, which has a very unpleasant odor. In the context of cost optimization, it is necessary to evaluate and pre-treat these components upstream if they exist at significant levels. When upstream quality improves, chlorine dosage can be significantly reduced while still achieving microbial targets, while also limiting odor and corrosion incidents in the contact area.
Another important aspect is the contact time and hydraulics in the disinfection channel. Although the concept of CT (concentration – time) is often used in design, in actual daily cost optimization, operators can achieve higher efficiency by minimizing hydraulic short-circuiting, evenly distributing chemicals, and maintaining pH in the favorable range mentioned. Combining automatic control to adjust dosage according to instantaneous microbial loads can help avoid "fixing" the dosage at a high level; continuous monitoring data provides early warnings when the system experiences unusual fluctuations, thereby avoiding unnecessary dosage increases.
4. Optimization with Ozone and UV: When to Choose and How to Optimize
Ozone is a very strong oxidizing agent. In water, ozone quickly decomposes into molecular and atomic oxygen, leaving no persistent by-products. The solubility of ozone is high, noted to be about 13 times that of oxygen, facilitating rapid disinfection if the dosage is sufficient. The disinfection time can be very short, around 3–8 seconds when ozone has dissolved to the necessary threshold for both organic oxidation and bacteria. Regarding dosage, operational documents provide reference ranges: 0.75–1 mg/l for groundwater; 1.0–3.0 mg/l for surface water; and after settling tank 2 in the wastewater treatment process, it can be at levels of 5–15 mg. However, it is important to emphasize that practical application must go through testing and on-site monitoring, as these parameters also depend on the specific water composition and microbial load.
In exchange for speed and the "clean" nature after treatment, ozone often entails higher capital investment and energy consumption compared to chlorine. Ozone generation systems through electrical discharge need to control cooling to prevent ozone decomposition before entering the contact chamber. However, ozone also produces some positive "side effects" such as reducing the oxygen demand of water, removing color, phenol, and cyanide, increasing DO, and aiding in the settling of suspended particles. All of this can help the upstream or downstream system operate more smoothly, thus offsetting some energy costs.
With UV, the main mechanism is to destroy the DNA of microorganisms, with the effective wavelength typically around 254 nm. In plants, low-pressure mercury lamps are commonly used, emitting light near 253.7 nm, placed in glass tubes that allow the light to pass through into a water layer about 6 mm thick. Effectiveness depends on the energy delivered and contact time; operational documents record energy consumption levels in the range of 6000–13000 microwatt/s, with lamp lifetimes around 3000–8000 hours. Although no chemicals are used, UV still requires maintenance to clean the surface of the tubes, control turbidity to ensure light penetration, and plan for periodic lamp replacement to avoid performance degradation – factors that directly determine the actual costs of this technology.
5. Process for Evaluating – Monitoring Disinfection Effectiveness and Optimal Control
For microbial indicators, operational objectives should be based on feasible control thresholds and discharge targets. Domestic technical documents indicate that the target for Coliform can be set below 5000 MPN/100 ml for type A requirements or below 10000 MPN/100 ml for type B requirements. From this target, operating engineers develop a sampling – testing strategy with appropriate frequency, increasing frequency when the input load fluctuates or when there are signs of recontamination in the discharge line. For chlorine, it is advisable to measure pH at the chemical injection point and at the end of the channel, as pH directly affects the HOCl/OCl⁻ ratio and thus influences the level of microbial kill at the same dosage.
The testing process and determining the optimal dosage should be standardized in the laboratory and validated in the field. Regarding formulation, many treatment chemicals are often prepared as 1–10% solutions for easier quantification and dosage control. Although the Jartest method is often associated with coagulation – flocculation, the "test – measure – adjust" mindset can completely apply to disinfection: changing dosage, adjusting pH, evaluating contact time, measuring Coliform after a certain cycle to derive optimal settings. Connecting monitoring data with controllers allows for automatic control loops, optimizing in real-time and significantly reducing variability due to manual operations.
Enhanced monitoring is also a tool for reducing chemical costs. When the quality of water after settling fluctuates seasonally or according to production shifts, early warning systems help operators quickly adjust dosages, avoiding the maintenance of high dosages as a "precautionary" measure. Automation – based on operational experiences – not only provides real-time data but also shows long-term trends, allowing for proactive cleaning – maintenance of UV lamps, calibration of ozone delivery equipment, or pH control to maintain favorable HOCl regions without increasing chlorine dosages.
6. Joint Optimization of Upstream Processes to Reduce Disinfectant Chemical Consumption
Disinfectant chemicals are often "blamed" when operating costs rise, but the root cause lies in the pollution load and competing reactive compounds that have not been well controlled upstream. Improving settling efficiency, reducing turbidity, removing easily oxidizable organic compounds, and substances such as ammonia or phenol will significantly reduce the necessary disinfection dosage. In activated sludge stations, optimizing aeration – which can account for up to 50% of the system's energy – helps stabilize the biological process and reduce fluctuations in organic load to the settling tank, thus improving the quality of influent water for disinfection. Effective sludge management – accounting for about 20% of energy in many units – also prevents the re-suspension of fine particles, improving UV light transmission conditions and reducing the need for strong oxidants like chlorine or ozone.
Optimizing pH across the entire line is also a significant lever. With chlorine, the relationship between pH and the HOCl/OCl⁻ ratio has shown clear advantages when operating at lower pH levels. This suggests the approach of "adjusting pH first, reducing dosage later": if pH is brought to a range where HOCl predominates, the bactericidal effectiveness of the same dosage will be higher, allowing for a significant reduction in chemical amounts. With UV, controlling turbidity and periodically cleaning the tube surfaces helps reduce the required energy for light; with ozone, controlling bubble formation, temperature, and contact time helps enhance mass transfer efficiency, avoiding waste due to ozone decomposition before it has fully dissolved.
Some opportunities for "reducing dosage through pre-treatment" include: enhancing coagulation – flocculation when water has high turbidity; neutralizing pH appropriately to reduce competing reactions; removing odor – color through preliminary oxidation when necessary. These steps are not intended to "replace" disinfection but to shift the right work to the appropriate step, allowing the disinfection chamber to focus solely on killing microorganisms, thus enabling dosage and contact time to be optimized to more reasonable levels.
7. Core Technical Data for Technology Decision Making
The table below summarizes some key technical data from domestic references to assist engineers and managers in quickly comparing common disinfection technologies. Note that dosage values and parameters are empirical/typical data; application requires testing and on-site adjustments.
| Item | Chlorine and Chlorine Compounds | Ozone | UV (Ultraviolet Light) |
|---|---|---|---|
| pH Dependency | Very strong; HOCl/OCl⁻ varies with pH (pH≈6: HOCl ~99.5%; pH≈7: HOCl ~79%; pH≈8: HOCl ~25%) | Not pH dependent according to HOCl/OCl⁻ mechanism; mass transfer efficiency needs to be controlled | Dependent on turbidity/light penetration rather than pH |
| Rate/Contact Time | Dependent on pH and CT; affected by ammonia, phenol | Very fast when sufficiently dissolved; about 3–8 seconds | Dependent on dosage and contact time in the chamber |
| By-product Characteristics | Can form chlorophenol causing odor when phenol is present | Does not leave behind long-lasting toxic by-products | Does not create by-products in water |
| Dosage/Experimental Reference | Adjusted according to pH and load; no fixed values stated in documents | Groundwater: 0.75–1 mg/l; Surface water: 1.0–3.0 mg/l; After settling 2: 5–15 mg | Energy delivered around 6000–13000 microwatt/s |
| Equipment Characteristics | Standard dosing equipment; requires chemical safety | Ozone generator by electrical discharge; needs cooling | Low-pressure Hg lamp 253.7 nm; water layer about 6 mm |
| Durability/Lifetime | Dependent on corrosion and retention; not fixed | Dependent on operating conditions; not fixed | Lamp lifetime around 3000–8000 hours |
| Performance Notes | Effectiveness decreases at high pH (HOCl decreases); avoid phenol | Stronger activity than chlorine; dissolves about 13 times better than oxygen | Requires appropriate clarity; periodic cleaning maintenance of tubes |
8. Implementation Roadmap for Optimization: Process – People – Technology
The first step is to standardize microbial objectives, pH set points, and operating modes of the contact channel. Based on Coliform targets and the quality of water after settling, businesses design sampling plans and optimize in cycles: adjusting pH before chlorine injection, measuring Coliform after the channel; if using UV, measuring turbidity and monitoring energy delivery within reference ranges; if using ozone, adjusting airflow – contact time to achieve recommended levels. The entire process should be recorded as a "setup – response" matrix to derive the actual optimal point for each typical operational load/case.
Next, introduce automation at high-value points: monitoring pH before/after chlorine injection to maintain favorable HOCl regions; monitoring UV lamp power and turbidity to command tube cleaning and lamp replacement timely; monitoring ozone generator power and temperature to maintain stable ozone generation. Operational experience shows that automatic control and continuous monitoring provide real-time data for dosage adjustment decisions, early warnings, and energy optimization – thereby indirectly reducing chemical costs or material replacement costs.
Finally, link the optimization of the disinfection step with the "health" of upstream processes. Improving settling efficiency to reduce turbidity helps UV work more effectively; removing phenol and ammonia limits competing reactions with chlorine; optimizing activated sludge and aeration – which can account for 50% of the station's energy – helps reduce fluctuations in organic and microbial loads, thus keeping disinfection dosages stable and lower in the long term. Implementing improvements in short cycles, measuring effectiveness, and viewing disinfection costs as part of the overall system optimization problem will yield more sustainable results than localized optimization.
9. In-depth Operational Notes to Avoid "Burning Money" on Disinfection
First, always consider pH as the decisive variable when using chlorine. A change of just one pH unit can cause the ratio of HOCl – the highly effective form – to drop from around 79% to 25% (from pH 7 to pH 8), necessitating an increase in dosage to compensate for effectiveness. Managing pH to favorable regions will allow for "doing more with less chlorine". At the same time, review the presence of phenol to avoid forming chlorophenol that causes unpleasant odors; if detected, it should be treated upstream rather than trying to "push" by increasing chlorine – this often increases costs without addressing the root cause.
Second, with ozone, always remember that high effectiveness comes with the requirement to control mass transfer and energy. Ozone has a solubility about 13 times higher than oxygen, and when sufficiently dissolved, can kill microorganisms very quickly in a few seconds; however, if the design – operation of the contact chamber is not optimized, the ozone that has not yet dissolved will be lost, increasing energy costs without proportional effectiveness. Use dosage references such as 0.75–1 mg/l for groundwater; 1.0–3.0 mg/l for surface water; and 5–15 mg after settling tank 2 as starting points for testing, then adjust based on field measurement results.
Third, with UV, water quality (especially turbidity and fouling on the tubes) is the "energy and effectiveness valve". Low-pressure UV lamps at a wavelength of about 253.7 nm have a lifespan of about 3000–8000 hours; energy delivery is usually in the range of 6000–13000 microwatt/s. Without a systematic cleaning – lamp replacement schedule, the actual energy delivery will silently decline, forcing an extension of contact time or an increase in the number of operational lamps – ultimately increasing costs while still not effectively controlling microorganisms. Maintaining regular cleaning and monitoring light transmission parameters will help the system operate at the optimal point.
10. Connecting Compliance Objectives and Cost Practices
Optimizing disinfection costs cannot be separated from compliance objectives. When subject to applicable regulations, businesses need to cross-reference with QCVN 01-MT:2015/BTNMT to determine appropriate discharge requirements. Additionally, internal technical objectives regarding Coliform can be set according to safe operational thresholds, such as below 5000 MPN/100 ml for type A requirements or below 10000 MPN/100 ml for type B requirements, depending on the specific case. Measurement – control systems need to be established according to the principle of "setting objectives – measuring – adjusting", using actual data as the basis for changing dosages and contact times, rather than rigidly setting parameters based on intuition.
From a financial perspective, every dollar spent on improving upstream (reducing turbidity, removing ammonia/phenol, stabilizing pH) often saves multiple dollars in downstream disinfection processes. Furthermore, when considering a change in technology (for example, switching from chlorine to UV or ozone), a life cycle cost model should be established, taking into account energy, maintenance, and material replacement (such as UV lamps), rather than just comparing "chemical prices". Automated operation and continuous monitoring – as noted in various systems – are sustainable factors that help control costs over time, enhance reliability, and reduce variability due to manual operations.
FAQ
1) Why does the effectiveness of disinfection vary with pH at the same chlorine dosage?
The effectiveness of chlorine depends on the ratio of HOCl and OCl⁻, which changes significantly with pH. At around pH 6, HOCl is dominant (~99.5%), but at pH 8, it drops to about 25%, causing effectiveness to decrease if the dosage remains unchanged.
2) Is ozone really faster than chlorine in disinfection?
When sufficiently dissolved in water, ozone can disinfect very quickly, in about 3–8 seconds according to empirical data, and has stronger activity than chlorine. However, achieving this speed requires well-designed and operated contact chambers to ensure effective mass transfer.
3) What should the target Coliform level be after disinfection?
Domestic technical documents record reference thresholds such as below 5000 MPN/100 ml (type A) or below 10000 MPN/100 ml (type B). Businesses need to cross-reference with applicable standards for specific cases and establish safer internal targets if necessary.
4) Does using UV consume a lot of energy?
In the contact chamber, UV energy delivery is recorded at around 6000–13000 microwatt/s, and lamps have a lifespan of about 3000–8000 hours. Actual costs depend on water quality (turbidity) and the cleaning – lamp replacement program.
5) What starting ozone dosage should be chosen for testing?
Reference ranges can be used: 0.75–1 mg/l for groundwater; 1.0–3.0 mg/l for surface water; and 5–15 mg after settling tank 2 in wastewater treatment. Then adjust based on microbial measurement results and related parameters in the field.
6) Does automation help reduce disinfection chemical costs?
Yes, automatic control and continuous monitoring help adjust dosages according to instantaneous loads, provide early warnings when water quality fluctuates, and optimize variables such as pH or energy delivery. This can reduce chemical waste and prevent unnecessary overdosing.
Nanoen
NANO THANG LONG ENVIRONMENTAL COMPANY LIMITED
Hanoi Office: No. 15 TT18 Van Phu Urban Area, Ha Dong, Hanoi
Can Tho Office: 661E/29, Vo Van Kiet Street, Binh Yen A Area, Long Hoa Ward, Binh Thuy District, Can Tho City
Ho Chi Minh City Office: 533/12/7, Pham Van Bach Street, Ward 15, Tan Binh District, Ho Chi Minh City
Hotline: 0986.689.781 - 0969.054.226
Email: thanglongnanoen@gmail.com
Facebook: www.facebook.com/thanglongnanoen